MMI Jammu
Parent Portal Dashboard
Welcome Back!
Mrs. Sharma 👋
Explore Dashboard
🌟 Star Pupil of the Week
Kudos to Aarav for his beautiful behavior and helping peers clean up blocks!
Notice Board 📌
🚌 Upcoming Field Trip Consent
Parents, please remember to sign and send back physical consent slips for the local nature park visit by Friday morning.
2 hours ago🎭 Traditional Dress Parade
Next Thursday will be our cultural showcase dress-up parade! Theme: "Heritage Outfits of India".
YesterdayVinayak's Daily Feed
Class Upper KG-B | Ms. Sharma
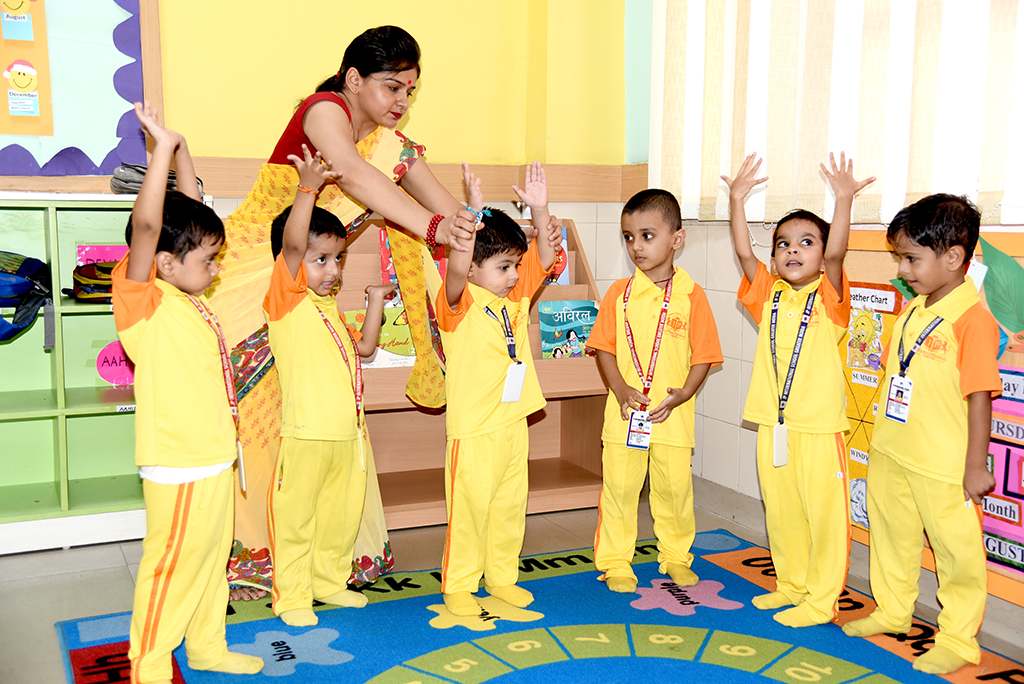
09:15 AM — Morning Mindfulness 🧘🏽♂️
Vinayak initiated the day with easy yoga poses wonderfully. He focused well during the deep breathing routine.
10:30 AM — Math Adventure 🔢
Today Vinayak learned about numbers at his class. He perfectly sequenced numbers up to 30 using bright counting beads!
12:30 PM — Nutrition Break 🥪
Ate his whole paneer paratha cleanly and shared his grapes nicely with Priya. Commendable manners!
01:45 PM — Motor Skills Clay Play 🎨
Vinayak sculpted a lovely green turtle figurine during the clay modeling hour. Very meticulous finger movements!